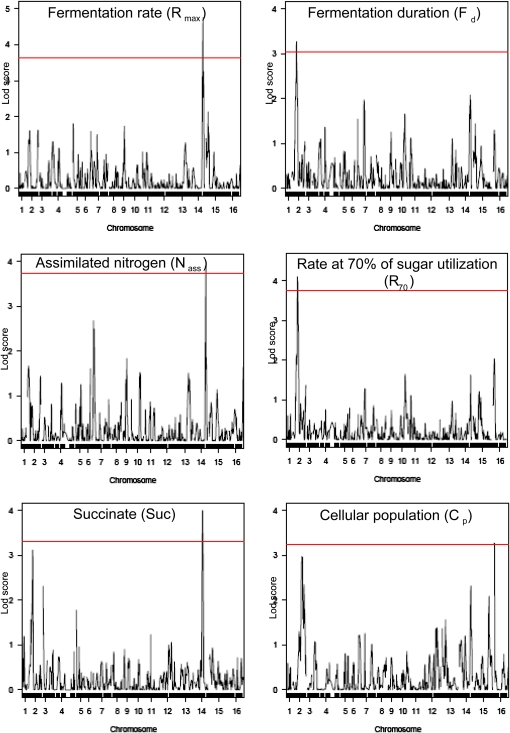
Figure 3 .
QTL mapping of kinetics traits and succinate production. The concatenated chromosomes are displayed on the X-axis and LOD score values on the Y-axis. The significant LOD score thresholds are indicated by a red line. Each peak of the LOD curve corresponds to the LOD value of linkage between a marker located in the X position and the value of each trait. Further details of QTL are in Table 2.

