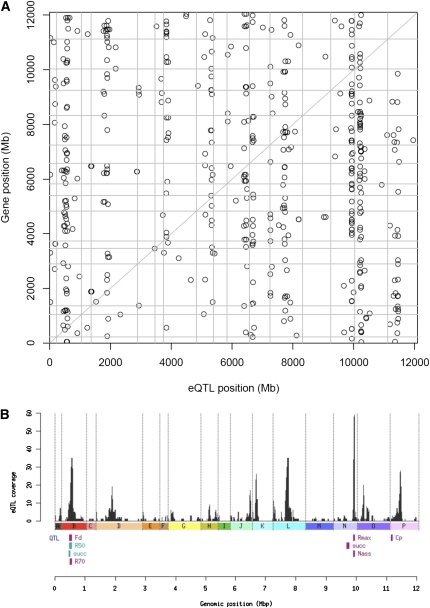
Figure 4 .
Genomic view of eQTL distribution and relationships with QTL for fermentation traits. A) Genomic view of eQTL mapping. The X-axis represents the genome location of markers, and the Y-axis represents the genome location of the regulated linked genes on concatenated chromosomes. EQTL values with LOD scores greater than 3.5 are displayed. The diagonal pattern is called “cis-eQTL band” and represents an association between the expression level of a gene and the genotype at the gene’s locus. Multiple vertical bands, called “trans-eQTL bands,” illustrate associations between the expression of many genes and a single locus. B) Overlapping of eQTL and QTL for fermentation traits. The scale below the figure indicates the genomic position across the genome in mega base pairs (Mpb). We can observe the overlapping of the hotspot on chromosome II with Fd, R70, R50, and succinate (succ) parameters and the overlap of the hotspot located on chromosome XIV with Rmax and Nass. QTL for traits with LOD scores just below the threshold are shown in blue.

