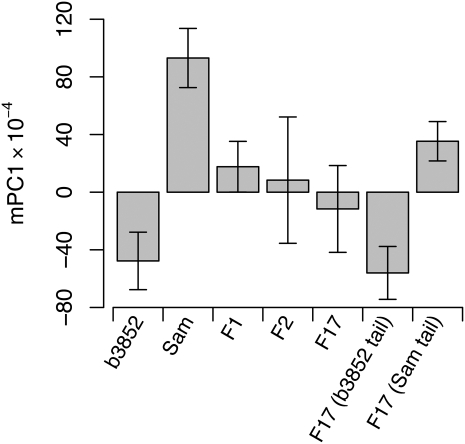
Figure 2 .
mPC1 lobe shape variation in b3852, Sam, F1, and recombinant genotype classes. Each bar shows the mean (± SD) of multiple individuals, taking just a single lobe from each fly: b3852 (N = 29), Sam (N = 25), F1 (N = 21), F2 (N = 367), F17 (N = 344), F17 b3852 tail (N = 47), and F17 Sam tail (N = 47). F1 males derived from reciprocal parental crosses have similar shapes and were averaged. The groups of F17 “tail” flies are the extreme individuals from either tail of the F17 phenotypic distribution.

