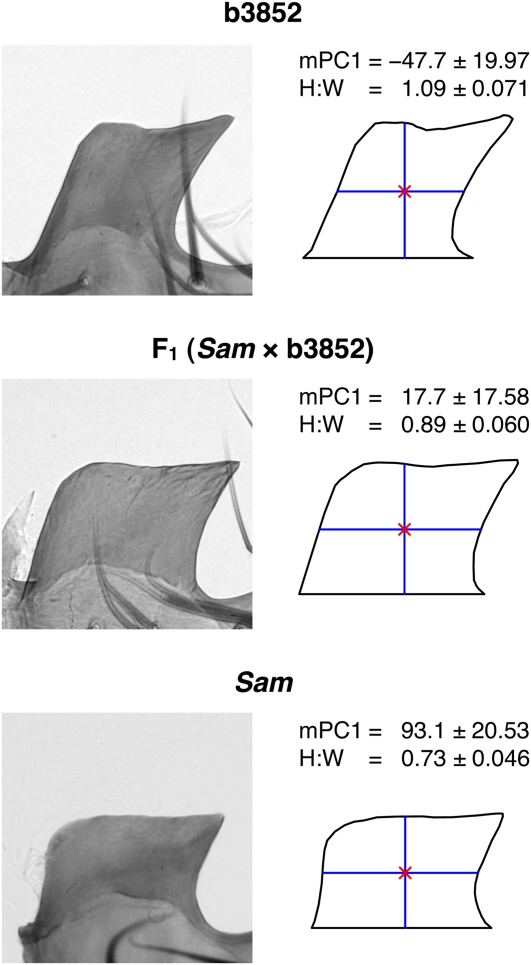
Figure 3 .
Morphology of the posterior lobe in the progenitors of the QTL mapping panels. On the left, a representative lobe image is presented for the two parental strains and the F1 hybrid (the result of a Sam female × b3852 male cross). The closed outlines derived from these images used for shape/size analysis are presented on the right. The red cross within each outline is the centroid, and blue lines represent lobe height and width. The mean (± SD) of the mPC1 (× 10−4) and height:width ratio (H:W) shape measures for each genotype highlight the inverse correlation between these two measures. Phenotype means are calculated from a single lobe from 29 b3852, 21 F1, and 25 Sam males.

