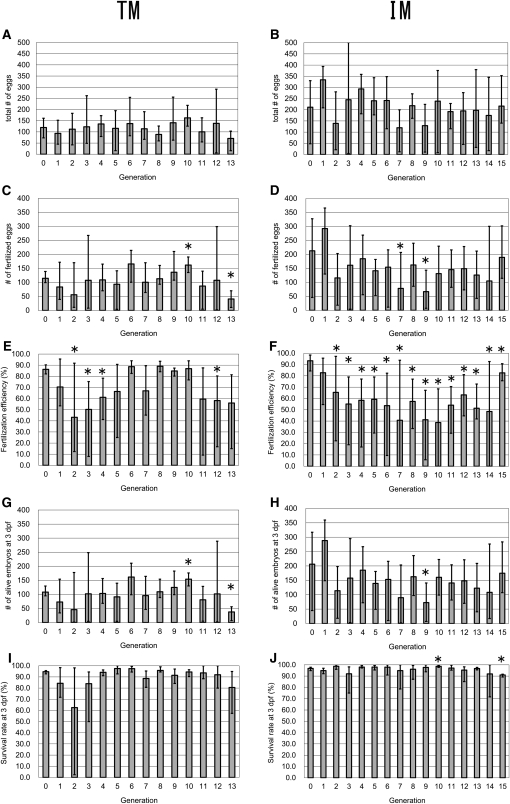
Figure 3.
Fertility of the TM and IM strains at each generation. Graphed data from TM (A, C, E, G, and I) and IM (B, D, F, H, and J) are shown. (A, B) Number of eggs per clutch. (C, D) Number of fertilized eggs per clutch. (E, F) Percentage of fertilized eggs per clutch (fertilization efficiency). (G, H) Number of embryos that survived until three dpf per clutch. (I, J) Percentage of embryos that survived until three dpf per clutch. Bars indicate mean values; error bars indicate range of values. Both maximum (up) and minimum (down) values are indicated. Asterisks indicate the significant differences (P < 0.05) from the values observed in generation 0.

