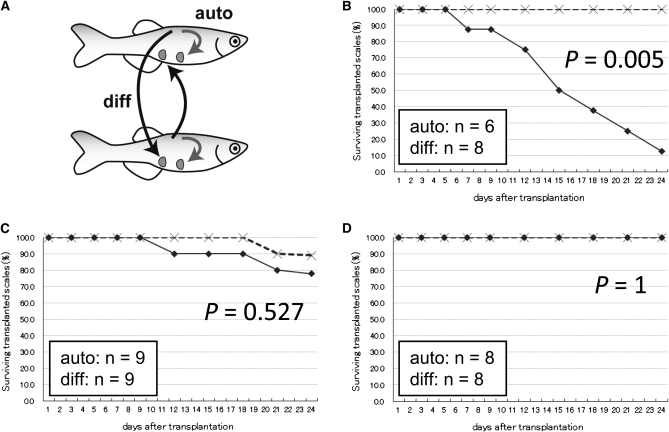
Figure 5.
Scale transplantation experiments. (A) Schematic representation of scale transplantation. A dorsal scale was always transplanted to the ventral side. The “diff” (black arrows) indicates transplantation between individuals, and “auto” (gray arrows) indicates transplantation within the same fish. (B–D) The percentage of surviving transplanted scales during the 24 days after transplantation. Crosses indicate autotransplantation, and diamonds indicate transplantation between individuals. Transplantation data from the India outbred strain (B), IM fish at generation 14 (C), and IM fish at generation 16 (D) are shown. P-values were calculated from the data at 24 days after transplantation.

