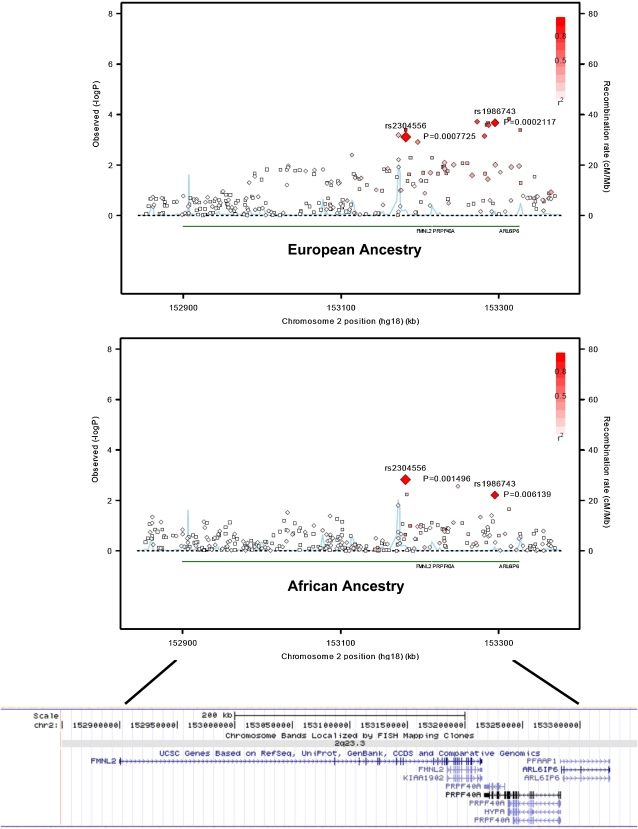
Figure 2 .
Regional association plots showing associations of FMNL2-ARL6IP6I region in European ancestry (top) and in African ancestry populations (middle), and the position of the genes in this region (bottom). Each diamond represents a single typed SNP, and each square represents a single imputed SNP. The color within each square/diamond represents the extent of LD correlation, r2, between the SNP and rs2304556. The blue line represents the recombination rate. Recombination rate and r2 were estimated based on HapMap3 CEU and YRI samples, respectively. Regional association plots were drawn by modifying the R program codes from the SNAP program, and the position of the gene were obtained from the University of California, Santa Cruz (UCSC) genome browser.

