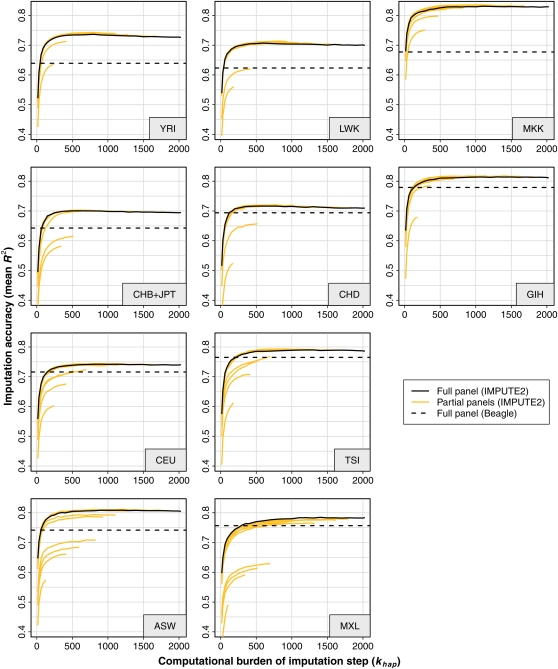
Figure 2 .
Imputation accuracy at low-frequency SNPs in HapMap 3 cross-validations, as a function of target panel, reference panel composition, khap value, and imputation method. These plots show the imputation accuracy of IMPUTE2 and Beagle in various cross-validation experiments. The accuracy of each experiment is plotted on the y-axis as the mean R2 across all SNPs with MAF < 5% in the cross-validation panel (identified by the gray box in each plot). The x-axis shows the khap parameter, which scales linearly with the computational burden of imputation updates in IMPUTE2. The solid black curves show how R2 varies with khap when using IMPUTE2 with a reference panel containing the full set of 2020 HapMap 3 haplotypes; the dashed black lines show the accuracy of Beagle with this reference panel. IMPUTE2 was also applied to subpanels of the full HapMap 3 panel, with results shown as orange curves. Similar plots for other observed SNP sets and imputed SNP MAFs can be found in File S3.

