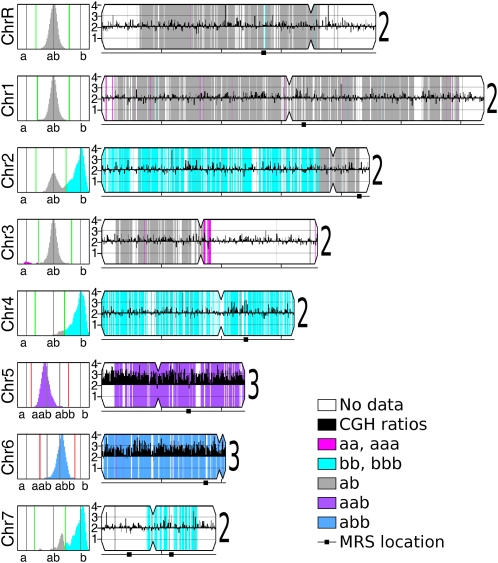
Figure 3 .
Visualization of SNP/CGH array data. Data for each strain analyzed by SNP/CGH array was visualized as illustrated for strain Ps8 (and in Figure S1 and Figure S2 for all other strains). Each chromosome is illustrated to scale, with its centromere position indicated by an indentation and major repeat sequence (MRS) positions indicted by a black square below the chromosome. CGH data were calculated as ratios, converted to chromosome copy numbers, displayed as black histograms along the length of the chromosome, and summarized with a large numeral to the right of the chromosome. For SNP alleles, allelic fractions for each chromosome are plotted in the left panels. SNP data were calculated and colored as described in Figure 2. Regions that were homozygous in the reference strain or were not informative were not colored. CGH, comparative genome hybridization; SNP, single nucleotide polymorphism.

