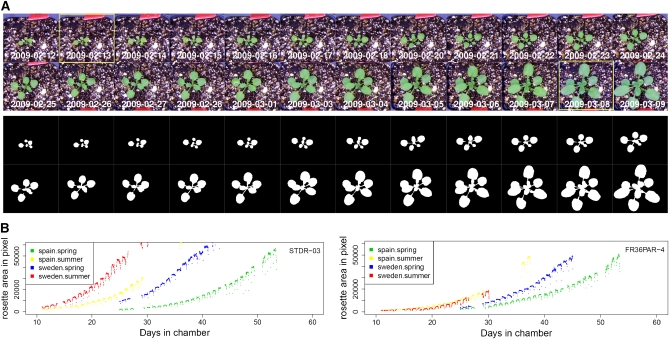
Figure 1 .
Detection of rosette area. (A) Detection of rosettes for images taken at 16:20:00 across days. The original images (upper) and the detected rosettes (lower). The boxed images represent plant at stage 1.04 and 1.10, respectively. (B) Rosette areas for accession STDR-03 (left) and FR36PAR-4 (right) were plotted against the number of days plants were grown in chambers, for Spain spring (green), Spain summer (yellow), Sweden spring (blue), and Sweden summer (red). Images were taken at 20 min intervals in daytime. Vacant points were due to missing data.

