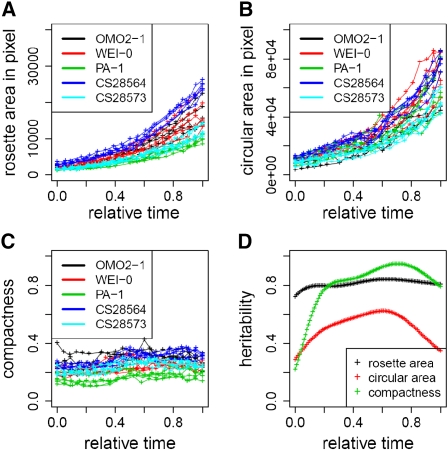
Figure 2 .
Genetic effect for rosette growth-related traits. Rosette area (A), circular area (B), and compactness (C) were plotted against relative growth time. Data points were obtained from noontime images across developmental stage 1.04 through 1.10 for each plant. Colors denote different accessions. (D) The broad sense heritability for rosette area (black), circular area (red), and compactness (green) was plotted against relative growth time. Heritability was calculated on spline-fitted data points.

