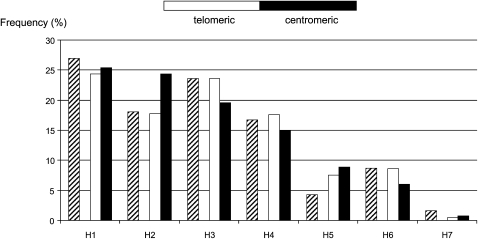
Figure 3 .
Haplotype frequency distribution observed at the two ends of haplotypes having a single recombination. The frequency distribution of founding haplotypes observed at the telomeric and centromeric ends of the 382 haplotypes having a single recombination is compared with the relative frequency distribution of the ancestral haplotypes in the sample (hatched bars, N = 1030). The frequency distribution at the telomeric end of recombinant haplotypes does not differ from the distribution of founding haplotypes (χ2 P = 0.56) whereas the frequency distribution at the centromeric end of recombinant haplotypes differed slightly (although significantly, χ2 P = 0.0003).

