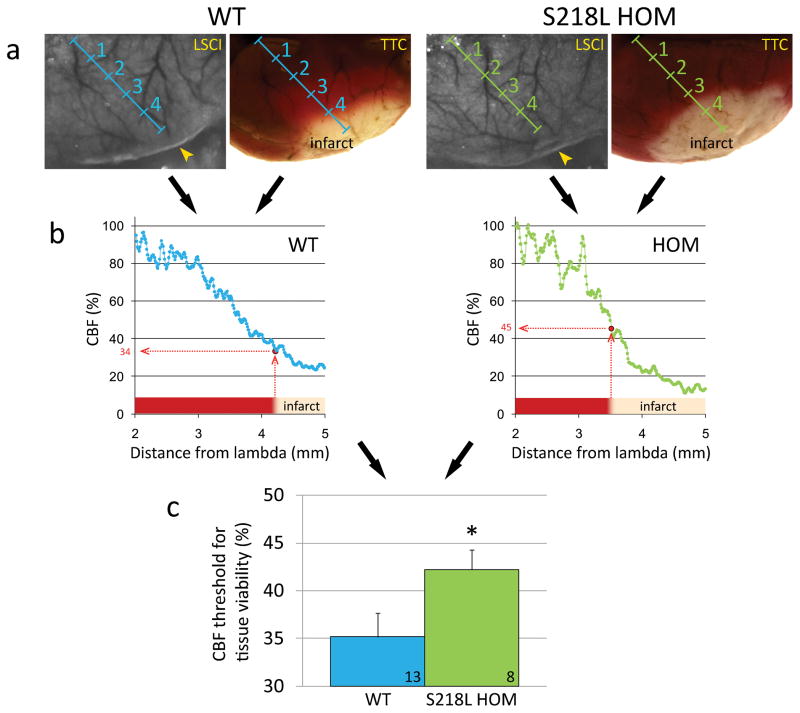
Figure 4.
Elevated blood flow threshold for tissue survival in FHM1 mutant mice. a) Representative laser speckle contrast images (LSCI) during dMCAO (left) and TTC-stained brain showing the infarct 48 hours after 60 min dMCAO (right) are shown for WT and S218L HOM mice. Imaging field was positioned as shown in Figure 3a. Images were spatially co-registered using surface landmarks. Line profiles (blue and green oblique lines, labeled in mm) were drawn between lambda and the clip occluding the middle cerebral artery branch (yellow arrowheads). b) For each animal, cortical blood flow (CBF) was plotted along these line profiles as a function of distance from lambda using laser speckle images, and the blood flow level corresponding to the infarct edge was determined (red dotted lines). This value represented the CBF threshold for viability, below which the tissue infarcted in each mouse. c) The average viability threshold was significantly higher in S218L HOM mutants compared to WT controls (p=0.048) indicating that FHM1 mutant brains are more vulnerable to ischemia and require higher blood flow to survive. Numbers of mice are shown on each bar. *p<0.05 vs. WT.

