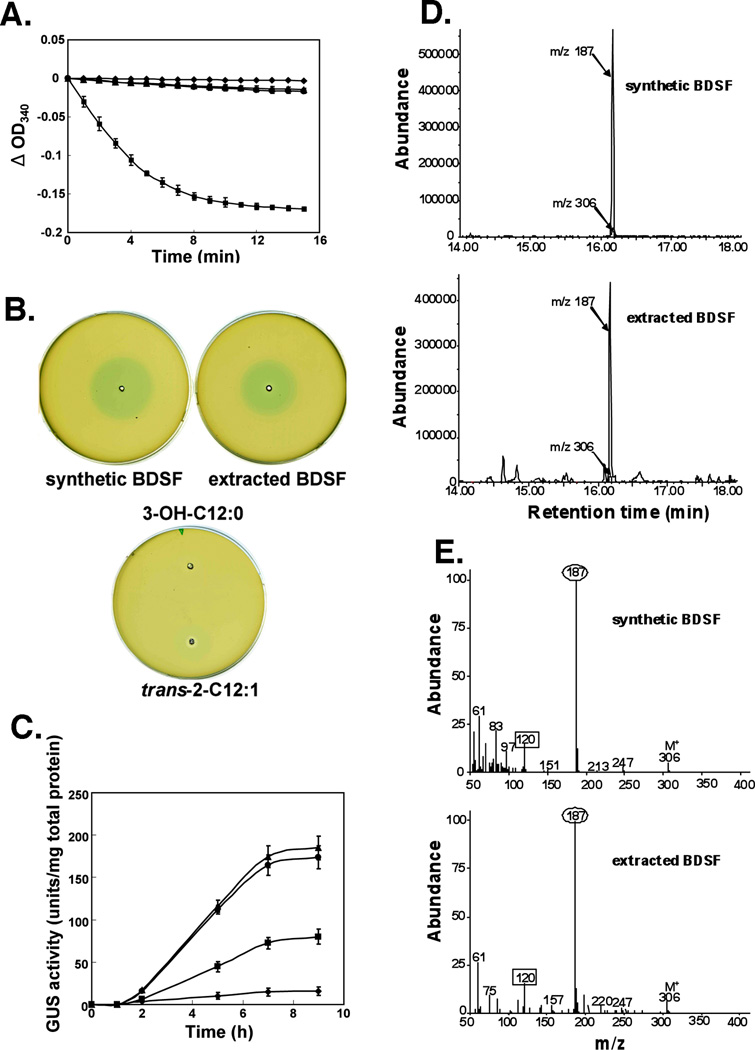
Fig. 7. Identification of the reaction products formed in vitro.
A. NADH oxidation activity of EcFabI using different substrates. NADH oxidation was monitored at 340 nm for the EcFabI reaction using trans-2-dodecenoyl-ACP(■), synthetic cis-2-dodecenoyl-ACP (●) or purified cis-2-dodecenoyl-ACP (○) from in vitro reactions run with simultaneous addition of Bcam0581 and AasS as described in Experimental procedures. Note that the ● and ○ symbols largely overlap. The □ symbol denotes background without addition of substrates. The controls without substrate showed no significant change in absorbance. The curves have been adjusted to the same zero time absorbance in the figure. The data are the means± standard error of the mean of three independent assays.
B. BDSF bioassay. Each well contains 10 µl of BDSF (either extracted from reaction mixtures or synthetic), trans-2-dodecenoic acid or 3-hydroxydodecanoic acid at a concentration of 60 µM. Synthetic BDSF was the positive control.
C. BDSF induction of endoglucanase expression in the DSF biosensor strain, Xcc8523 (pL6engGUS). The biosensor strain in which E. coli gusA encoding β-D-glucuronidase is fused to the engXCA promoter was cultured and exposed to BDSF samples. Samples of the cultures were collected at different time points after the addition (final concentration 60 µM) of trans-2-dodecenoic acid (■), synthetic BDSF (●) or BDSF extracted (○) from in vitro reactions. The in vitro reactions received simultaneous additions of Bcam0581 and AasS. □ denotes background without any additions. The β-D-glucuronidase activities were determined as described in Experimental procedures. The data are the means± standard error of the mean of three independent assays.
D. GC-MS chromatogram from analyses of the fatty acid extracted from a reaction mixture and synthetic BDSF. The fatty acids were derivatized first to their methyl esters and then to their dimethyl disulfide adducts which were analyzed by gas chromatography-mass spectroscopy. The elution profiles of DMDS adducts of the methyl esters show mass chromatogram peaks of m/z 187 and m/z 306.
E. Mass spectroscopy of the cleavage products of the dimethyl disulfide adducts of fatty acid methyl esters either extracted from a reaction mixture or synthetic BDSF. The unsaturated esters gave a cleavage fragment of m/z 187 (numbers in ovals) corresponding to the methyl end of the molecule plus a second fragment m/z 120 (numbers in squares) corresponding to the ester end of the molecule (expected m/z 119).

