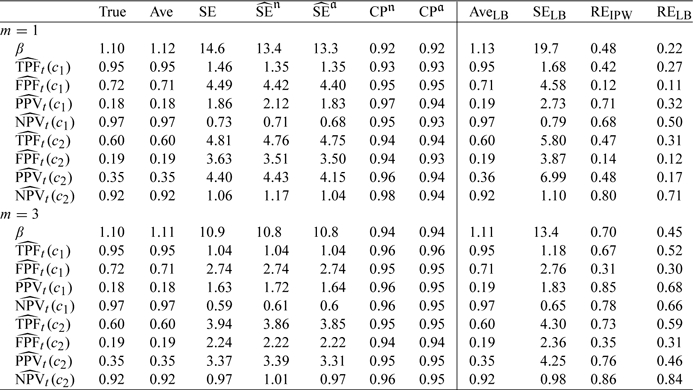
Table 1.
Averages of parameter estimates (Ave), empirical standard error of estimates (SE), the averages of the standard error estimates from naive () and adjusted () estimators, their corresponding coverage probabilities (CPn and CPa) using the “IPW” approach, average and empirical standard error using the “LB” approach (AveLB and SELB) based on NCC samplings with cohort size of N = 1000 and m = 1 or 3 controls. Relative efficiencies of both approaches (REipw and RELB) are relative to the cohort. Accuracy summaries of marker Y are evaluated at t = 1 and c1 = FY−1(0.25), c2 = FY−1(0.75), respectively. Censoring times are independent of Y
 |
