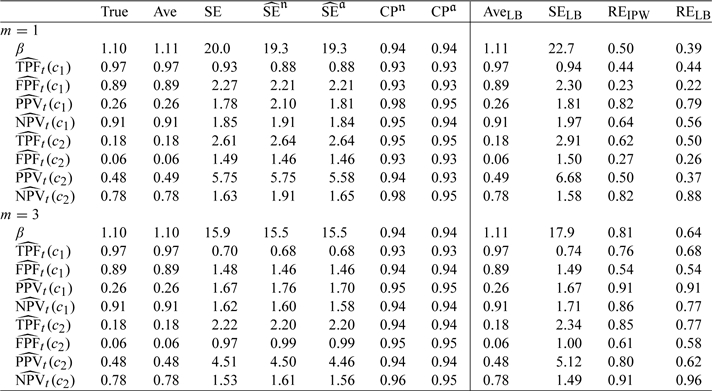
Table 2.
Summary statistics (same as in Table 1.) from simulation studies based on NCC samplings with cohort size of N = 1000 and m = 1 or 3 controls and with censoring times dependent on Y
 |
Summary statistics (same as in Table 1.) from simulation studies based on NCC samplings with cohort size of N = 1000 and m = 1 or 3 controls and with censoring times dependent on Y
 |