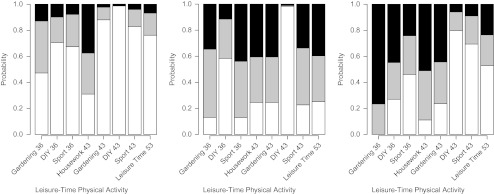
Figure 4.

Bar plots of the probability of a positive response for each leisure-time physical activity variable (e.g., gardening at age 36 years) for each latent class (n = 1,823; class A (left), 48.2%; class B (center), 35.5%; class C (right), 16.5%) among females, National Survey of Health and Development, United Kingdom, 1982–1999. White bars, inactive; gray bars, less active; black bars, most active. DIY, do-it-yourself.
