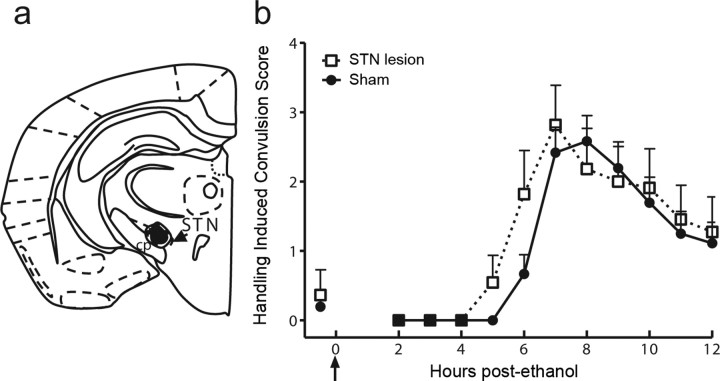
Figure 6.
STN lesions did not alter ethanol withdrawal severity. a, Schematic of histological sections depicting the extent of confirmed STN lesions (only 1 side is shown). Black shaded areas represent the minimal lesion area, and the hatched areas represent more extensive lesions observed in some animals. b, Bilateral STN-lesioned and sham-lesioned D2 mice were scored for baseline HICs immediately before administration of 4 g/kg ethanol (arrow marks ethanol injection at time 0) and hourly between 2 and 12 h after ethanol administration. Data represent the mean raw scores ±SEM for baseline and postethanol HICs. Although the data suggest the possibility of a shift in the withdrawal time course in STN-lesioned animals, statistical analyses of these data did not detect a significant difference at any time point, or in the overall time course. Inset, Bilateral STN lesions did not reduce ethanol withdrawal scores calculated as AUC, compared with the sham-lesioned group (p = 0.6). cp, Cerebral peduncle.

