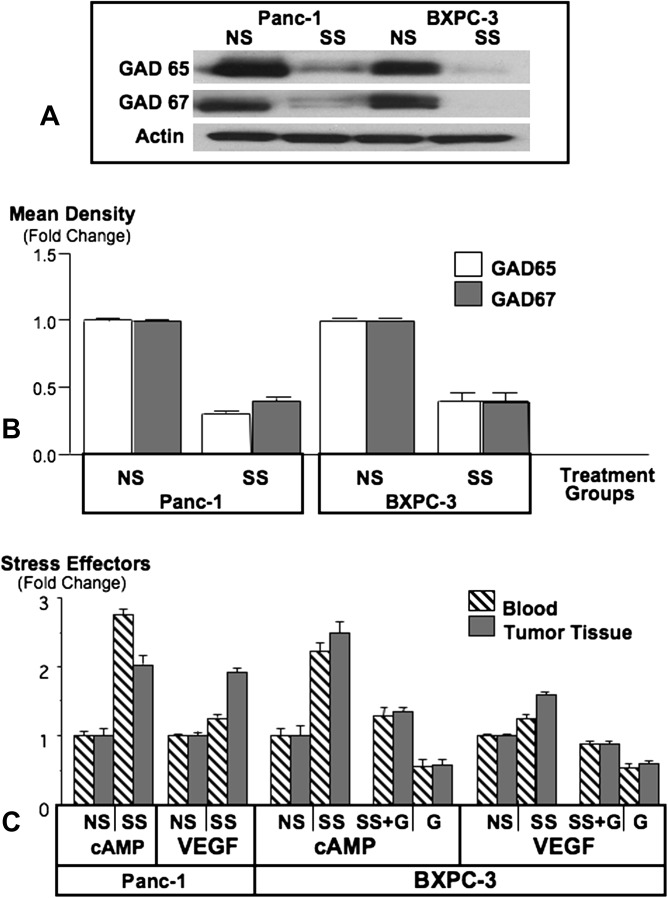
Fig. 3.
Western blot (A) showing suppression of GAD65 and GAD67 by social stress (SS) in xenografts from cell lines Panc-1 and BXPC-3. Columns in the graph (B) are mean values and standard deviations of four densitometric readings per band adjusted for actin in independent blots prepared from three randomly selected xenografts per treatment group. Graph (C) illustrates levels of intracellular cAMP in the cellular fraction of blood and in xenograft tissues and levels of VEGF in serum and xenograft tissues. Columns are mean values and standard deviations of five randomly selected samples per treatment group.

