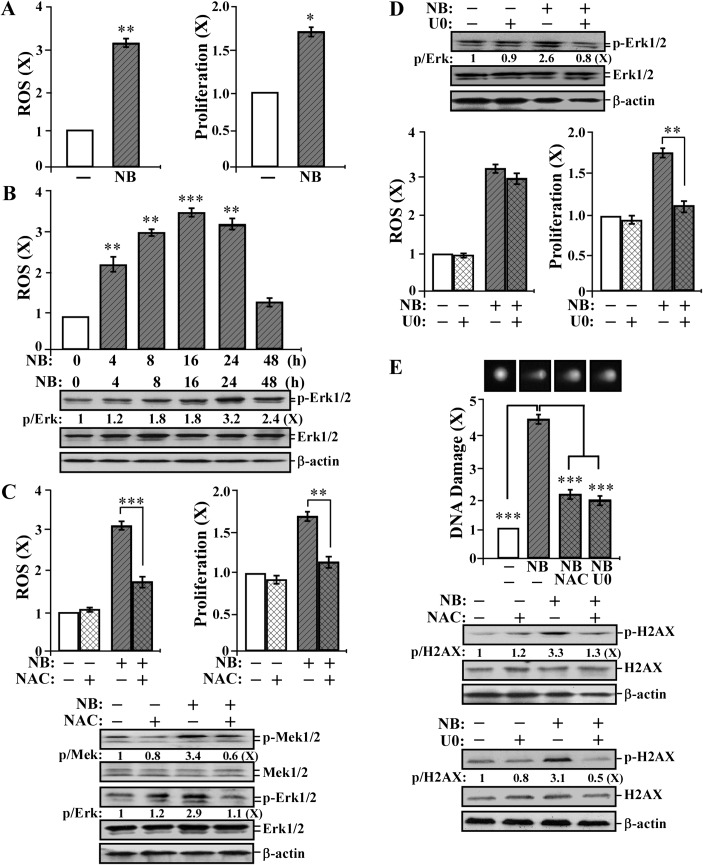
Fig. 2.
Short-term-targeted end points: ROS elevation, the ERK pathway, cell proliferation and DNA damage transiently induced by short-term exposure to NNK and B[a]P. (A) MCF10A cells were exposed to combined NNK and B[a]P (NB) each at 100 pmol/l for 24 h. (B) MCF10A cells were exposed to NB for 0, 4, 8, 16, 24 and 48 h. (C, D and E) MCF10A cells were exposed to NB in the presence or absence of 5 mmol/l NAC or 10 μmol/l U0126 (U0) for 24 h. (A–D) ROS levels were measured with chloromethyl-dichlorodihydro-fluorescein-diacetate labeling; relative level of ROS as fold induction was normalized by the level determined in untreated counterpart cells, set as 1 (X, arbitrary unit). (A, C and D) Cell proliferation was determined; relative cell growth rate was normalized by the value of BrdU detected in untreated counterpart cells, set as 1 (X, arbitrary unit). (B–E) Cell lysates were prepared and analyzed by western immunoblotting to detect levels of phosphorylated Mek1/2 (p-Mek1/2), Mek1/2, p-Erk1/2, Erk1/2, p-H2AX and H2AX, with β-actin as a control, and these levels were quantified by densitometry. The levels of specific phosphorylation of Mek1/2 (p-Mek), Erk1/2 (p-Erk) and H2AX (p-H2AX) were calculated by normalizing the levels of p-Mek1/2, p-Erk1/2 and p-H2AX with the levels of Mek1/2, Erk1/2 and H2AX, respectively, and then further normalizing with the β-actin level and the level set in untreated cells (lane1) as 1 (X, arbitrary unit). (E) DNA damage was measured by a comet assay in 50 cells per treatment; relative DNA damage was normalized by the value determined in untreated counterpart cells, set as 1 (X, arbitrary unit). Representative images of cells treated in the comet assay are shown. Columns, mean of triplicates; bars, SD. All results are representative of at least three independent experiments. The Student’s t-test was used to analyze statistical significance, indicated by *P < 0.05, **P < 0.01, ***P < 0.001; α levels were adjusted by the Simes method.

