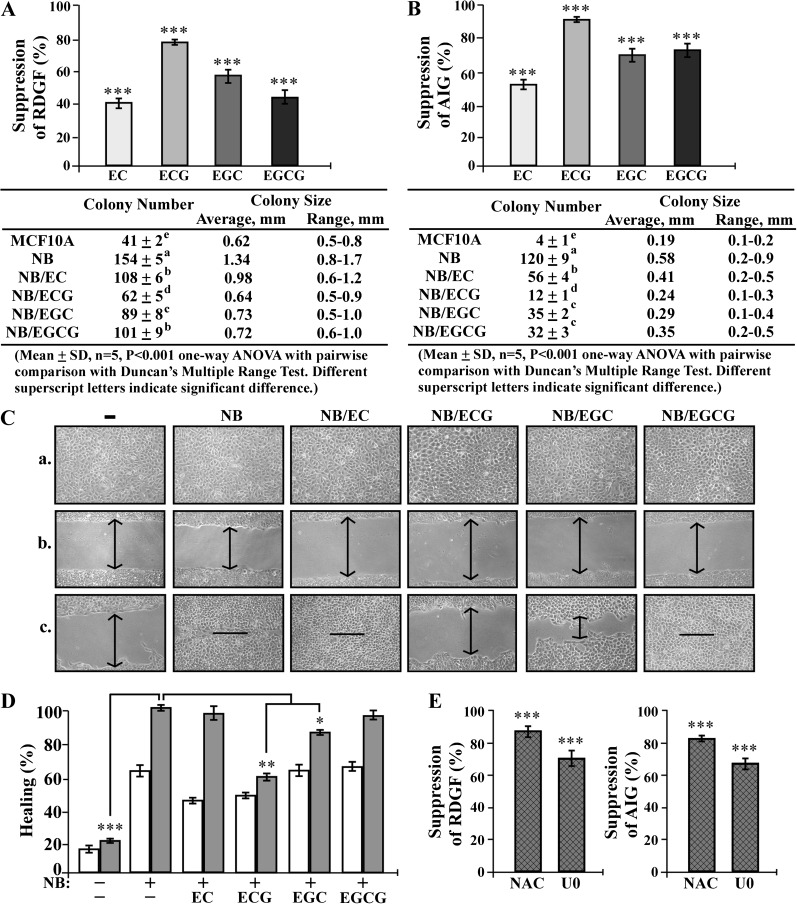
Fig. 6.
Catechin suppression of chronically NNK- and B[a]P-induced carcinogenesis. (A–D) MCF10A cultures were repeatedly exposed to combined NNK and B[a]P (NB) each at 100 pmol/l in the presence of 10 μg/ml of EC, ECG, EGC and EGCG (NB/catechin) for 10 cycles. (E) MCF10A cultures were repeatedly exposed to NB in the presence of 5 mmol/l NAC or 10 μmol/l U0126 (U0) for 10 cycles. (A and E) To detect effectivity of individual catechins, NAC and U0 on suppression of cellular acquisition of reduced dependence on growth factors (RDGF), 5 × 10³ cells were seeded and maintained in LM medium for 10 days. (B and E) To detect effectivity of individual catechins, NAC or U0 on suppression of cellular acquisition of anchorage-independent growth (AIG), 1 × 10⁴ cells were seeded in soft agar for 20 days. The value of the suppression effectivity of individual catechins on NB-induced RDGF (A and E) and AIG (B and E) was calculated by: {1 − [(# of NB/catechin-induced cell colonies) − (# of MCF10A cell colonies)] / [(# of NB-induced cell colonies) − (# of MCF10A cell colonies)]} × 100 (%). The Student’s t-test was used to analyze statistical significance, indicated by ***P < 0.001; α levels were adjusted by the Simes method. Tables show colony numbers, average colony size and range of colony size. Mean colony numbers in each treatment group were analyzed by one-way analysis of variance at P < 0.001 to indicate significant difference in number of colonies in various groups. To further determine the significant difference between individual groups, a pairwise analysis of variables was performed using the Duncan multiple range test. Means with different superscript letters (a, b, c, d and e) indicate significant difference at P < 0.001 between groups; no significant difference was seen between groups with the same superscript. (C) To detect effectivity of individual catechins in suppressing carcinogen-induced cellular acquisition of increased mobility, cells were seeded in CM medium and grown to confluence (a), a linear area of cell layer was removed from each culture with a 23-gauge needle to produce wounded cultures, and the wounded areas were examined (×100 magnification) 6 (b) and 24 h (c) after wounding. Arrows indicate width of wounded areas. Results are representative of three independent experiments. (D) To quantitatively measure cell mobility detected in (C), the area not healed by the cells was subtracted from total area of initial wound to calculate the wound healing area (%) at time intervals of 6 h (white columns) and 24 h (gray columns). Columns, mean of triplicates; bars, SD. All results are representative of three independent experiments. The Student’s t-test was used to analyze statistical significance, indicated by *P < 0.05, **P < 0.01; α levels were adjusted by the Simes method.

