
FIG. 4.
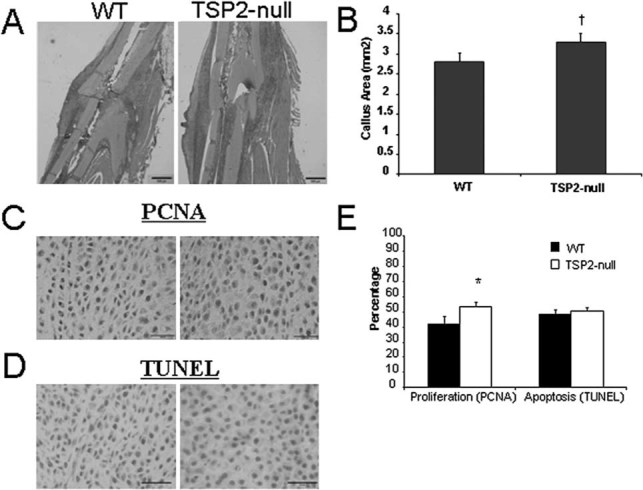
TSP2-null fractures 5 days after fracture show increased callus size and enhanced mesenchymal cell proliferation. (A) Safranin-O–strained tissues showing appearance of provisional callus but an absence of mature cartilage at 5 dpf (magnification bar = 500 μm). Note that Safranin-O staining at this time is generally nonspecific staining of provisional matrix and not bright red relative to the appearance of cartilage in Fig. 3. (B) Area of the fracture callus determined using histomorphometry is slightly greater in TSP2-null mice compared with WT. (C) PCNA expression was examined to evaluate the proliferation of mesenchymal cells. Brown nuclei are PCNA positive (magnification bar = 100 μm). (D) TUNEL was used to evaluate cells undergoing apoptosis. Brown nuclei are TUNEL+ (magnification bar = 100 μm). (E) PCNA staining is greater in the fracture callus of TSP2-null mice compared with WT mice, but there is no difference in TUNEL. Values are mean ± SE of WT (n = 13) and TSP2-null (n = 12) mice. *Significantly different from WT (p < 0.05).