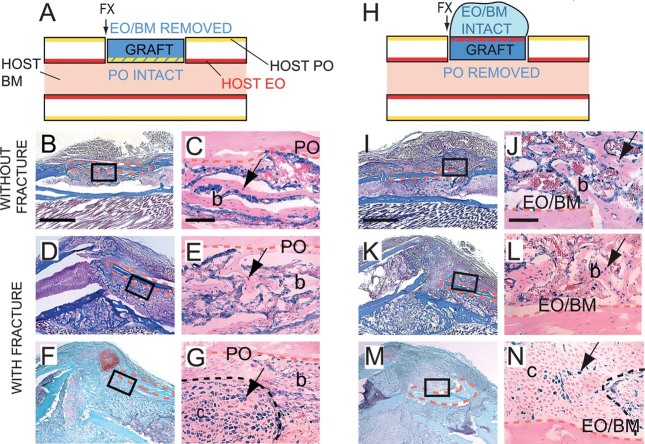
FIG. 5.
Effect of the tissue environment on cell differentiation in the periosteum and endosteum/bone marrow. (A and H) Schematic representation of Rosa 26 bone grafts (blue) with periosteum (PO, yellow) placed in the environment of endosteum/bone marrow or with endosteum/bone marrow (EO/BM, red) placed in the environment of the periosteum. Arrows indicates where the fracture is created. Sections through the bone graft were stained with TC (B, D, I, and K) and SO (F and M) and adjacent sections stained with X-gal (C, E, G, J, L, and N) at 10 (F, G, M, and N) and 14 (B-E and I-L) days after surgery. During bone graft (B and C) and nonstabilized fracture healing (D and E), X-gal-positive osteoblasts and osteocytes (arrow) derived from PO are found at the periosteal surface of the graft in the host bone marrow. (F and G) X-gal-positive chondrocytes (arrow) are detected in the same location. X-gal-positive osteoblasts and osteocytes (arrow) derived from EO/BM are located at the endosteal surface of the graft facing the host PO during bone graft (I and J) and nonstabilized fracture healing (K and L). (M and N) Only few X-gal-positive chondrocytes (arrow) are found in cartilage islands near the endosteal surface of graft. Dotted orange lines delimit the bone graft and black dotted line delimits the junction between cartilage and bone. b, bone; c, cartilage. Scale bars: B, D, F, I, K, and M = 1 mm; C, E, G, J, L, and N = 100 μm.

