
FIG. 4.
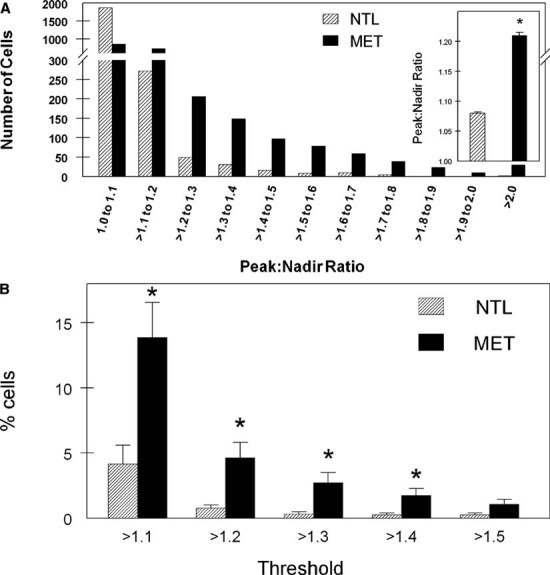
Quantitation of Cai in primary bone cells. Changes in Cai were quantified by two methods: (A) the distribution of cell number as a function of the peak to nadir ratio and (B) the percentage of cells with an increase in Cai above specific threshold values. (A) The ratio of the maximum to minimum Cai for each cell during the NTL and MET phases of perfusion was determined and the distribution of values plotted. The distributions were significantly different, p < 0.01. Inset, mean ± SE for all NTL and all MET cells. (B) The percentage of cells with an increase in Cai above each specified threshold. The peak in cell Cai was defined as an increase in Cai of greater than the specified threshold (1.1–1.5) over the mean of the previous five time points (time point taken every 2 s) for that cell. n = 2306 cells individually analyzed for A and B; *p < 0.05.