Table 1.
Inhibition of KB-3 Cell Survival Assessed by MTT Viability Assay.*
| Entry | Compound | IC50 (µM) |
|---|---|---|
| 1 |  |
20 |
| 2 |  |
5 |
| 3 | 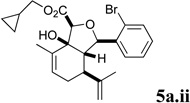 |
50 |
| 4 | 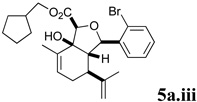 |
> 100 |
| 5 | 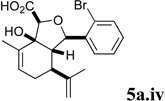 |
> 100 |
| 6 |  |
3 |
| 7 |  |
5 |
| 8 | 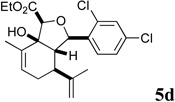 |
3 |
| 9 | 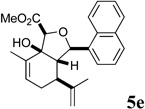 |
10 |
| 10 |  |
100 |
| 11 | 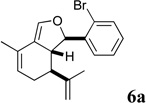 |
4 |
| 12 | 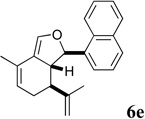 |
> 100 |
| 13 |  |
2 |
| 14 | 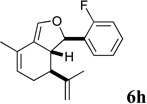 |
1 |
| 15 | 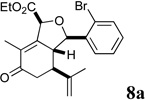 |
70 |
| 16 |  |
30 |
| 17 |  |
5 |
| 18 | 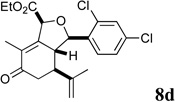 |
3 |
| 19 | 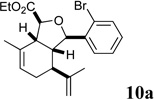 |
> 100 |
Cells were treated with increasing concentration of compounds and MTT viability assays were performed after 96 h. Values are the means of triplicate assays and are expressed as mean relative to untreated controls (see Supplementary data for details and representative concentration curves).
