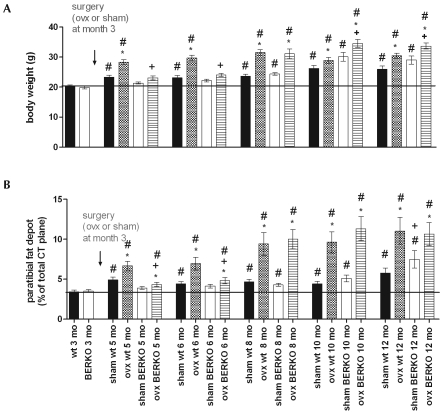
Figure 2.
(A) Body weight and (B) size of the paratibial fat depots in intact (sham) and ovariectomized (ovx) BERKO (−/−) and wildtype (wt) mice after surgery at 3 mo of age. *, P < 0.05 compared with value for intact mice of the same genotype; +, P < 0.05 compared with value for respective wild-type mice; #, P < 0.05 compared with value at 3 mo for mice of the same genotype. Black bars represent the mean value of WT at 3 mo of age (also shown as bar furthest to the left).

