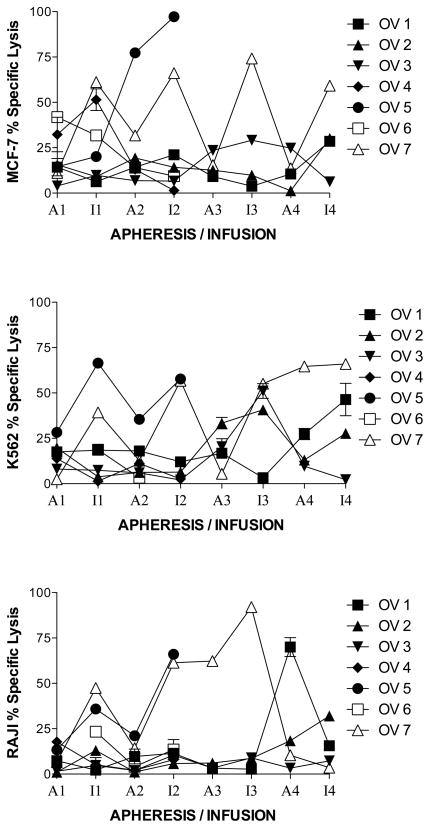
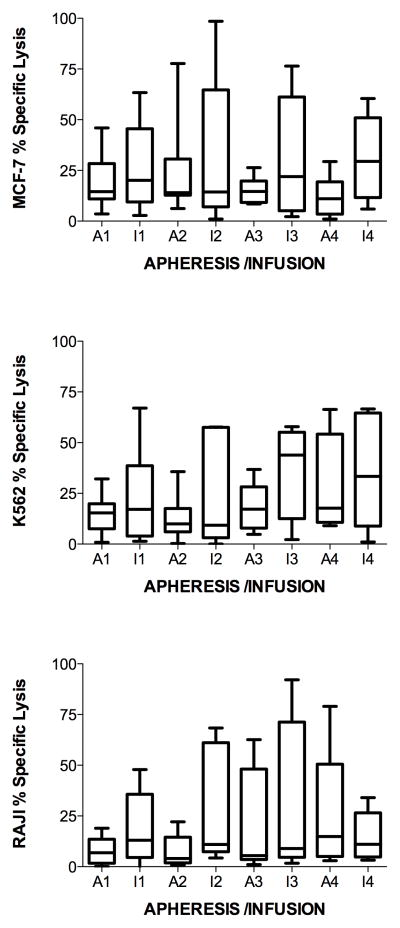
Figure 2.
MUC1-stimulated PBMC specific lysis of targets at effector to target cell ratio = 10:1. Aphereses were monthly. Infusions were at days 9 – 11 in culture. Apheresis (A) or infusion (I) and month (number) is indicated on the horizontal axis. A. Each patient is represented by a line. B. Boxes are 10th–90th percentiles and bars are 5th – 95th percentiles of the mean of 3 or 6 repetitions from each patient. Median is a line in the box.


