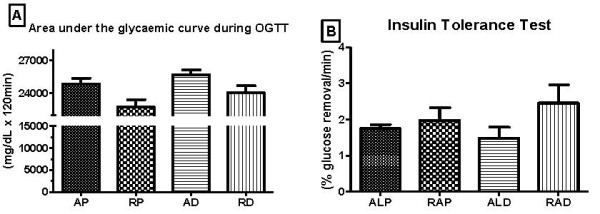
Figure 3.

Area under the glycaemic curve during glucose tolerance test (A) and % glucose removal during the insulin tolerance test (B) performed at the end of the experiment. AP = ad libitum pellet, RP = dietary restriction pellet, AD = ad libitum diet, and RD = dietary restriction diet. *≠ AP, RP, and RD (10 animals/group).
