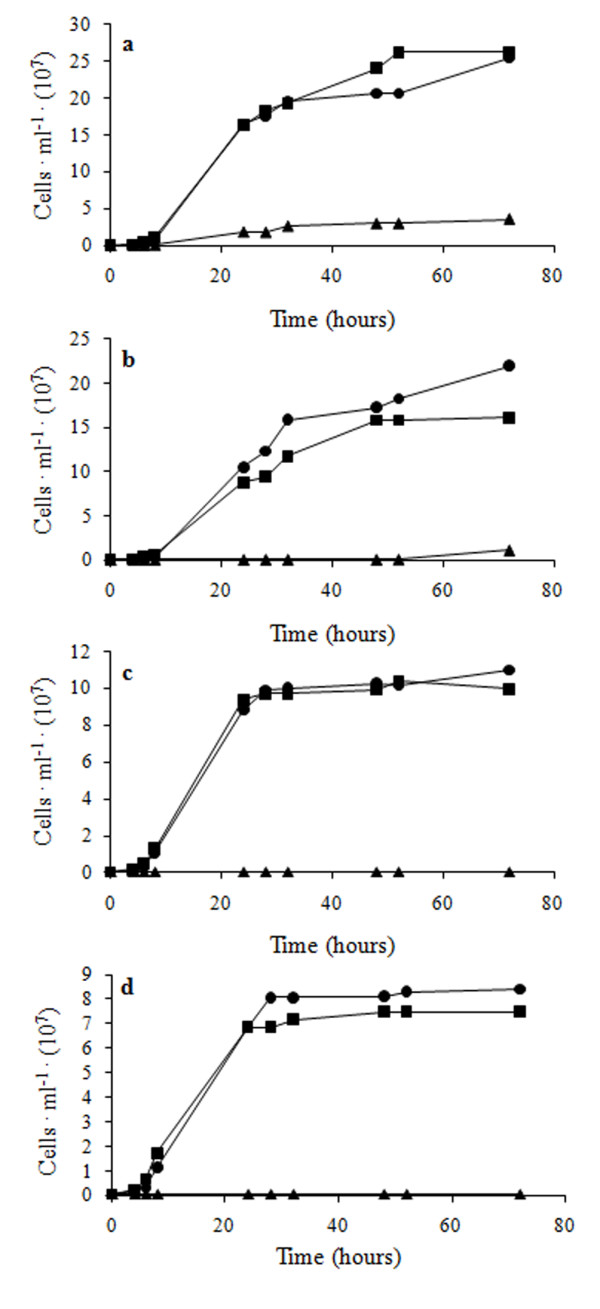
Figure 2.

Growth of yeast cells in YPD + 2.5 g · L-1 CuSO4. Evolved (black cirles), non-evolved (black triangles) and de-adapted (black squares) cells of C. humilis AL5 (a), S. cerevisiae BL7 (b), S. cerevisiae EL1 (c), S. cerevisiae GL6 (d). The values reported are averages of three replicates. Calculated standard deviations are ≤ 0.6, making error bars not appreciable.
