
Figure 3.
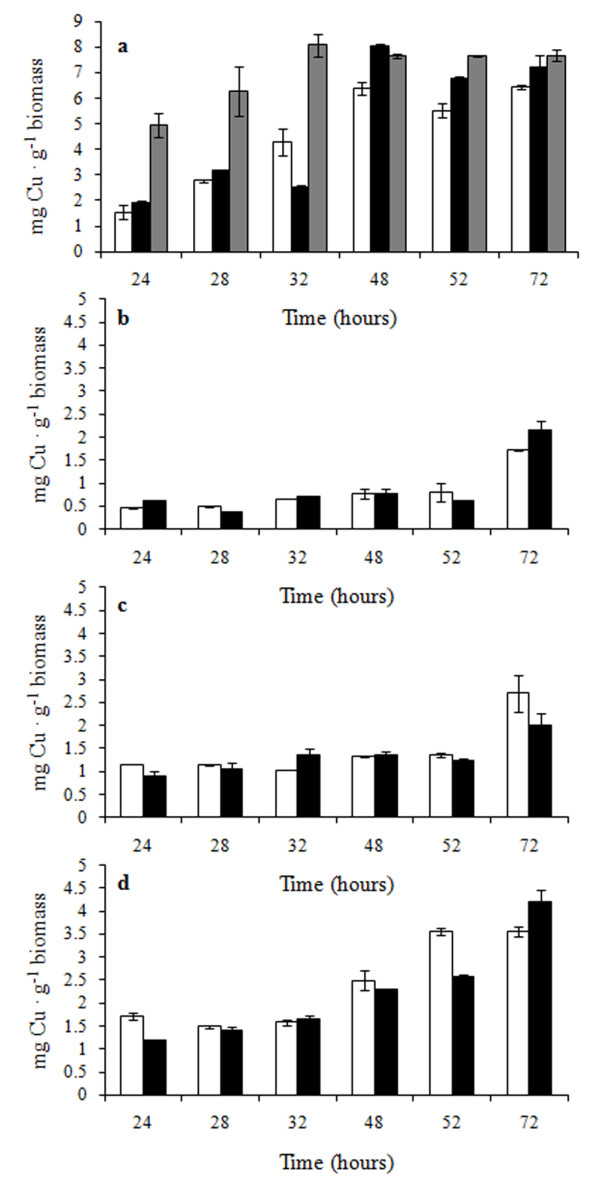
Intracellular copper measured during growth in YPD + 2.5 g · L-1 CuSO4. C. humilis AL5 (a); S. cerevisiae BL7 (b); S. cerevisiae EL1 (c) and S. cerevisiae GL6 (d). White bars: evolved cells; black bars: de-adapted cells; grey bars: non-evolved cells. The amount of Cu is reported as mg · g-1 biomass. Values are the average of three replicates. Note the change of scale in (a).