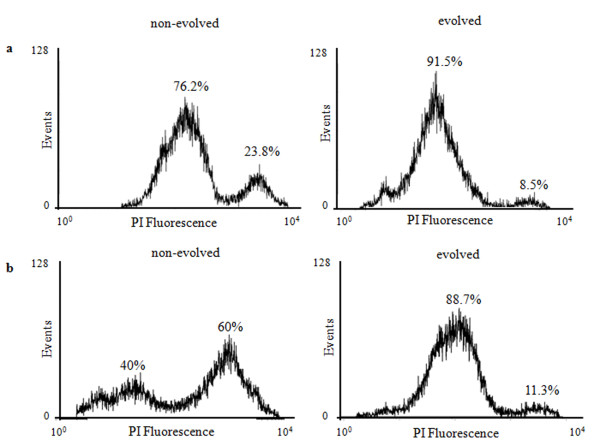
Figure 4.
Cytofluorimetric analysis. Evolved and non-evolved C. humilis (a) and S. cerevisiae (b) cells. Cells were collected during exponential growth in YPD + 2.5 g . L-1 CuSO4 and stained with propidium iodide. The x- and y-axes of the histogram display the log fluorescence intensity (PI) and the number of collected cells (events) per sample, respectively. Propidium positive cells are on the right side of the distribution whereas viable cells are on the left side. Fluorescence distributions are representative of three replicates obtained in independent experiments. This analysis was carried out with S. cerevisiae cells despite their extreme poor growth in copper medium thanks to the very small number of cells required.

