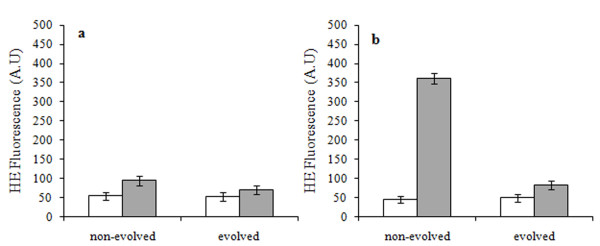
Figure 5.
Fluorimetric analysis of superoxide anion (OH-•) production. Evolved and non-evolved C. humilis (a) and S. cerevisiae (b) cells exponentially growing in YPD (white bars) and in YPD + 2.5 g . L-1 CuSO4 (grey bars). OH-• formation is expressed as fluorescence intensity of ethidium in arbitrary units. Data presented are the mean of at least three independent analyses.

