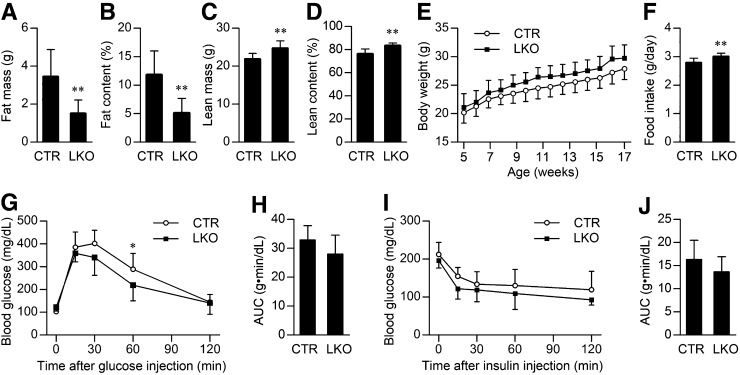
Fig. 2.
Hepatic Patt1 deficiency mainly leads to markedly decreased fat mass and fat content. (A, B) Fat mass and fat content were markedly decreased in male Patt1 LKO mice compared with littermate controls (CTR) at the age of 20 weeks as measured by an NMR spectroscopy. (C, D) Lean mass and lean content were moderately increased in male Patt1 LKO mice at the age of 20 weeks as measured by NMR. (E) Male Patt1 LKO mice showed slightly increased bodyweight. P = 0.0413 as measured by two-way ANOVA. (F) Food intake of the male Patt1 LKO mice was also slightly increased at the age of 15–17 weeks. (G) Glucose tolerance was slightly improved in 15-week-old male Patt1 LKO mice as determined by glucose tolerance test. *P < 0.05 versus the blood glucose level at the same time point. (H) The area under the curve (AUC) of the glucose tolerance test in (G) was similar between male Patt1 LKO mice and their littermate controls. (I) Male Patt1 LKO mice had similar insulin sensitivity as their littermate controls at the age of 17 weeks as determined by insulin tolerance test. (J) The AUC of the insulin tolerance test in (I) was similar between male Patt1 LKO mice and their littermate controls. n = 10–12/group, **P < 0.01.

