Fig. 1.
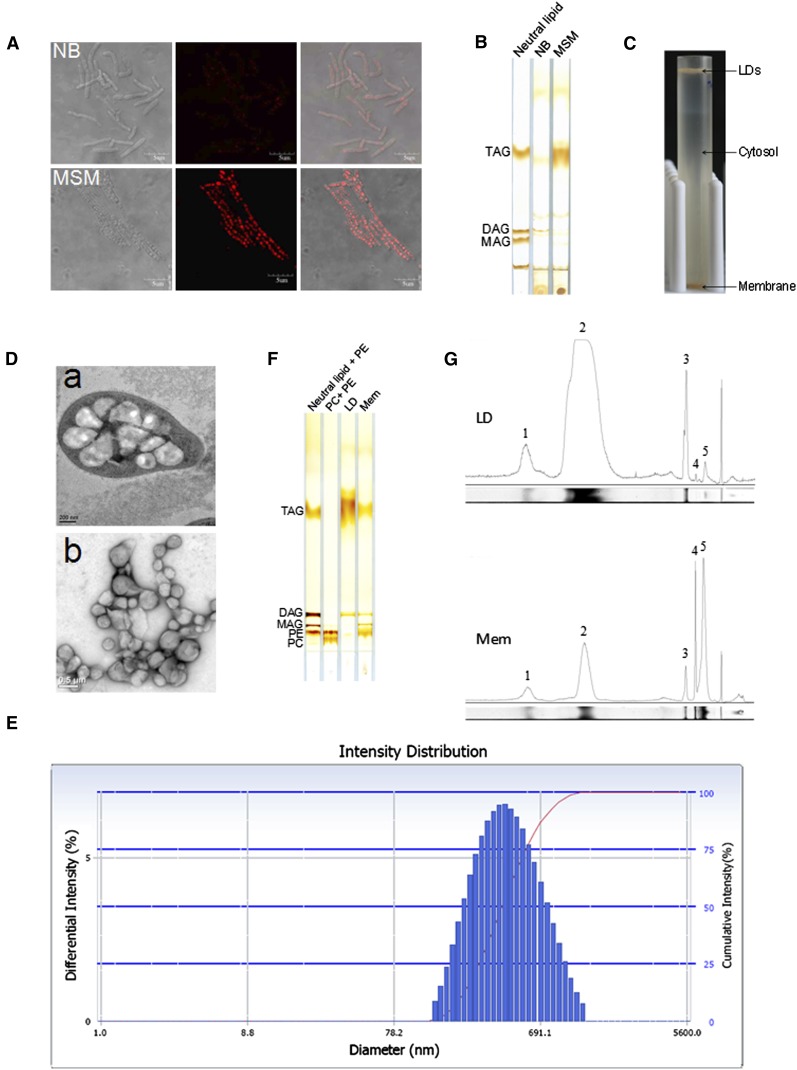
Isolation of lipid droplets from Rhodococcus sp. RHA1. A: Cells of strain RHA1 cultivated in NB and MSM were stained by Lipid-TOX and imaged by confocol microscopy. Left panel, the phase-contrast images; middle, the corresponding fluorescence images; right panel, the merged images. Bar = 5 μm. B: Total lipids were extracted from NB and MSM cultures (quantities normalized by protein concentration) and subjected to TLC analysis. C: RHA1 cells cultivated in MSM were collected and homogenized. After removal of cell debris, whole-cell lysate ultracentrifugation was performed at 182,000 g for 1 h at 4°C (Beckman SW40). The lipid droplet fraction floated to the top of the sucrose gradient while the total membrane fraction remained at the bottom. D: D-a, ultra-thin sections of RHA1 cultivated in MSM and imaged by EM (bar = 0.2 μm). D-b, isolated LDs imaged by EM after negative staining (bar = 0.5 μm). E: Purified LDs were collected from the top of the sucrose gradient in the SW40 tube, and then analyzed with a Delsa Nano C particle analyzer. The distribution of LD intensity according to diameter is shown. F: Total lipids were extracted from purified LD and total membrane fractions, respectively, followed by TLC analysis. The TLC plate was visualized by iodine vapor. G: The lipid content was semi-quantified by grayscale scanning (NIH ImageJ software). The area under the peak reflects the content of each component. 1, unknown neutral lipid; 2, TAG; 3, DAG; 4, MAG; 5, PE.

