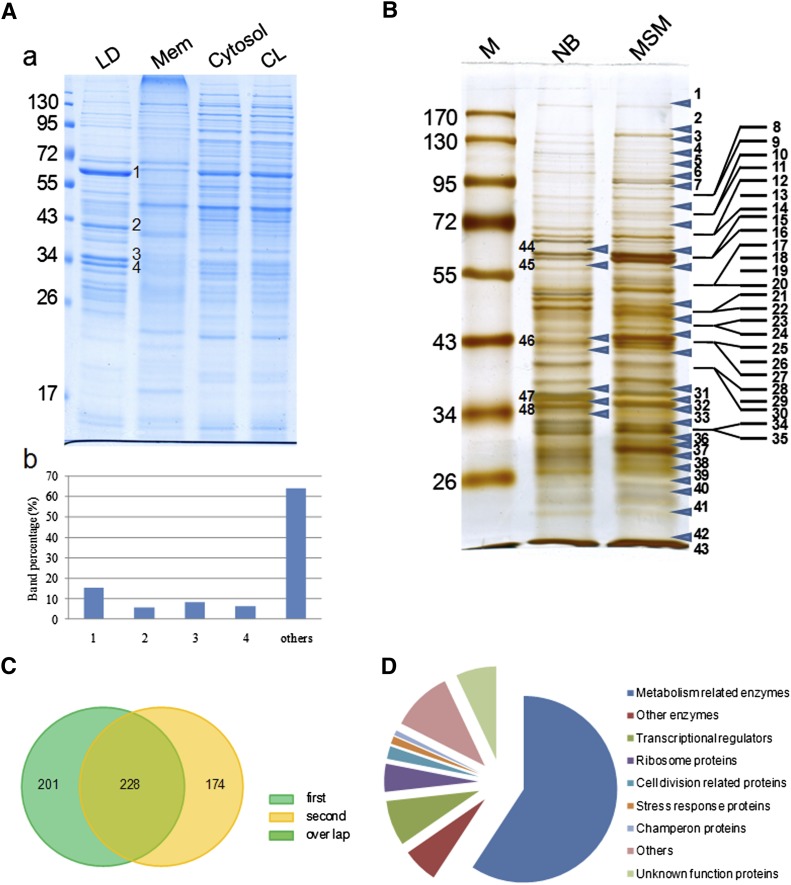
Fig. 2.
Analysis of LD-associated proteins by proteomics and bioinformatics. A: A-a, RHA1 cells cultivated in MSM were collected and fractionated as described in MATERIALS AND METHODS. Proteins from purified lipid droplets (LD), membrane (Mem), cytosol, and whole-cell lysates (CL) were separated by 10% SDS-PAGE followed by Colloidal Blue staining. A-b, bands in the LD protein lane were quantified by grayscale scanning (Alpha Ease Fluor Chem). The table shows the ratio of the main bands: 1: 15.4%; 2: 5.8%; 3: 8.2%; 4: 6.4%. B: LD protein bands were analyzed by LC-MS. Forty-three bands from the MSM sample lane, and the five bands from the NB sample corresponding to the major bands in the MSM sample were analyzed. Arrows indicate the positions at which the gel was sliced. C: To improve the reliability of our analysis of LD proteins, two samples were analyzed separately by LC-MS. Two hundred twenty-eight LD-associated proteins were present in both samples of RHA1 cells cultivated in MSM. D: The 228 LD-associated proteins were categorized into nine groups after searching against the RHA1 genome, Pfam, and NCBI databases.

