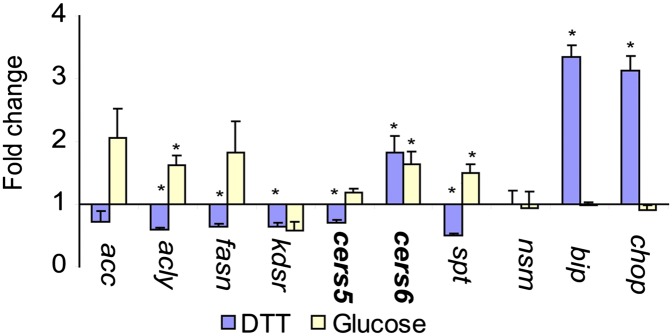
Fig. 5.
Effects of UPR activation in INS-1E cells. A: Real time RT-PCR analysis of genes involved in lipid biosynthesis under UPR induction. Cells were treated with the same compounds and for the same length of time as in Fig. 4 and RNA was harvested for quantification. Full gene names and primers can be found in Table 2. Asterisks indicate P < 0.05 relative to untreated control.

