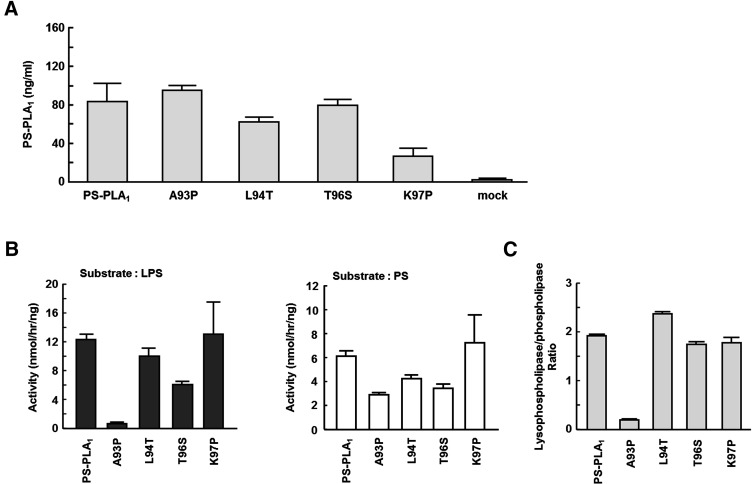
Fig. 7.
Lysophospholipase activity of single amino acid mutants. A: HEK 293 cells were transiently transfected with plasmids encoding single amino acid PS-PLA1 mutants. Expression of each mutant was examined by sandwich ELISA. B: Phosphatidylserine (PS, left panel) and lysophosphatidylserine (LPS, right panel) were incubated at 37°C for several h with conditioned media in 100 mM Tris-HCl (pH 7.5). Then, enzyme activity was determined by quantifying fatty acids liberated and exhibited as calculated enzyme activity per ng protein of the single amino acid mutants. Results are presented as bar charts of mean values ± SD depicted by error bars. C: The ratio of lysophospholipase to phospholipase was expressed as calculated enzyme activity to LPS per to PS. Bars indicate mean values and error bars indicate SD.

