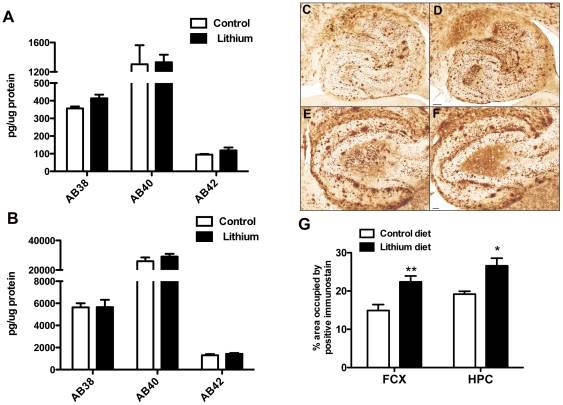
Figure 3. Lithium treatment of APPSwDI/NOS2−/− mice does not change Aβ levels but does increase Aβ deposition.
Panels A and B show biochemical ELISA measurement of Aβ38, 40 and 42 in soluble (A) and insoluble (B) protein extracts. Panels C–F show representative images of the whole hippocampus at 40× magnification (C and D) and the dentate gyrus of the hippocampus at 100× magnification (E and F) of APPSwDI/NOS2−/− mice receiving control diet (C and E) or lithium diet (D and F). Scale bar in D for C and D = 120 µm, scale bar in F for E and F = 50 µm. Panel G shows quantification of percent area occupied by positive stain for mice receiving control diet (N = 8) or lithium diet (N = 11) for 8 months. * indicates P<0.05, ** indicates P<0.01 when compared to APPSwDI/NOS2−/− mice receiving control diet.

