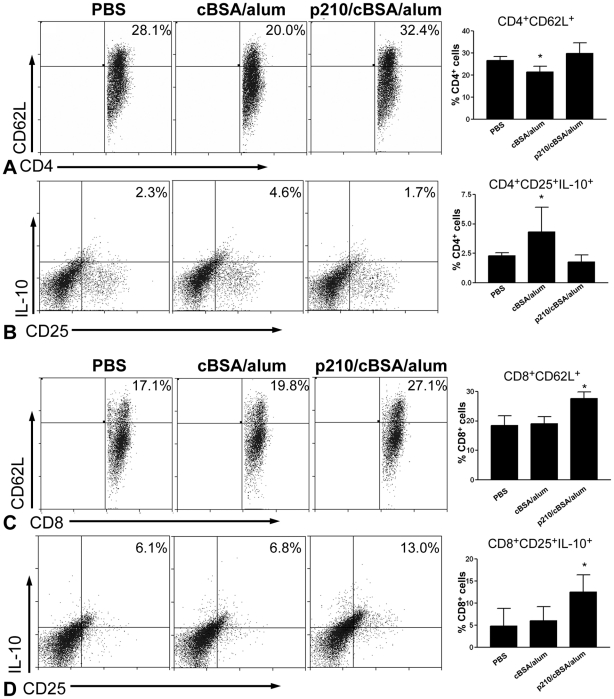
Figure 3. Spleen T lymphocyte response to p210 immunization.
(A) Representative scatter plots of CD4+ gated cells expressing CD62L from spleens of the different groups, and the results plotted in a bar graph showed a significant reduction in the cBSA/alum group. (B) Representative scatter plots of CD4-gated CD25+IL-10+ cells, and the results plotted in a bar graph showed a significant increase in the cBSA/alum group that was attenuated in the p210/cBSA/alum group. (C) Representative scatter plots of CD8b+ gated cells expressing CD62L, and the results plotted in a bar graph showed a significant increase in the p210/cBSA/alum group. (D) Representative scatter plots of CD8b-gated CD25+IL-10+ cells, and the results plotted in a bar graph showed a significant increase in the p210/cBSA/alum group. For all graphs, *P<0.05 vs. other groups; N = 5 each; ANOVA followed by Newman-Keuls multiple group comparison.

