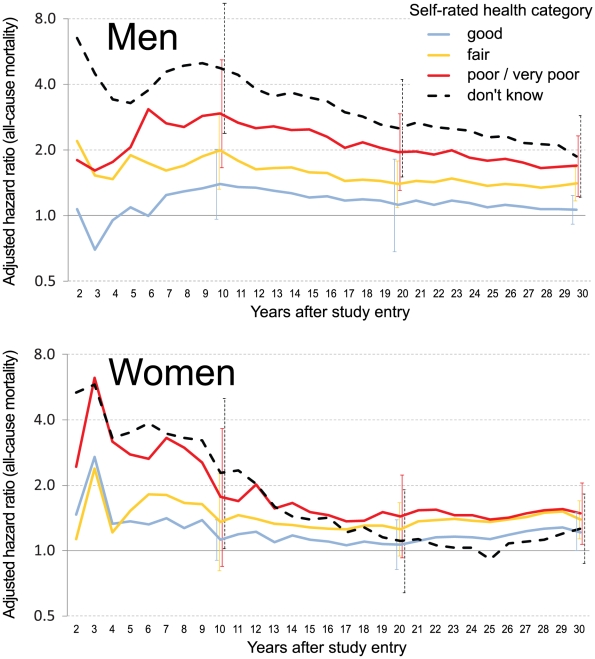
Figure 2. Adjusted hazard ratios for all-cause mortality, by self-rated health category, sex and increasing length of follow-up (referent: excellent SRH, n = 7,959).
95% confidence intervals are given for hazard ratios after 10 years, 20 years and maximum follow-up. Adjustment for age, marital status, educational level, smoking status, medical history, medication status, fasting blood glucose and systolic blood pressure.

