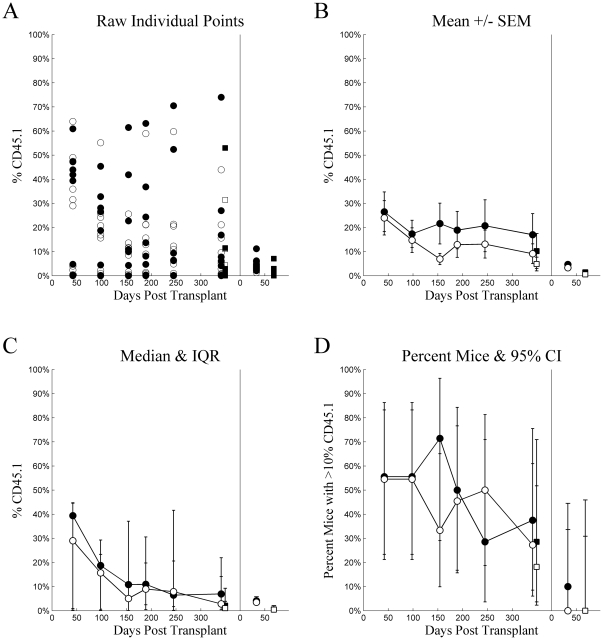
Figure 5. Experiment 2: intrafemoral injection.
Chimerism (%CD45.1) (ordinate) plotted as a function of Days Post Transplant (abscissa), type of cells injected (•▪: LT-HSC, ○□: ST-HSC), and source (•○: whole blood, ▪□: whole bone marrow) for several different methods of summary: A) raw individual mouse percent CD45 cells that were CD45.1, B) mean ± standard error of the mean, C) median with inter-quartile range, and D) percent of mice with greater than 10% of CD45 cells being CD45.1. For each tile, the data from the primary transplant is plotted on the left and secondary transplant on the right, separated by a vertical line at zero for the secondary transplant.

