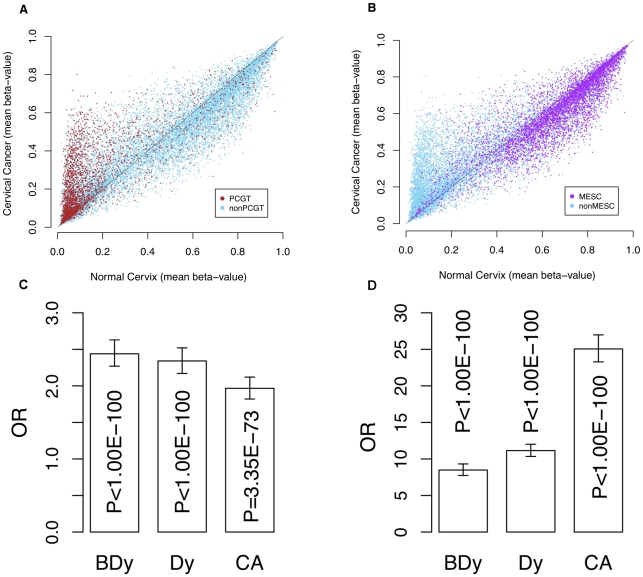
Figure 1. Methylation profile of PCGTs and MESCs in cervix data.
Scatter plots of mean β-values in normal cervical tissue (x-axes) vs. cervical cancer tissue (y-axes) of (A) all CpGs with PCGTs highlighted in brown and (B) all CpGs with MESCs highlighted in purple. (C) is the bar chart indicating the enrichment odds ratios (OR) and P-values (Fisher-test), testing for enrichment of PCGTs among CpGs unmethylated in normal cervix (mean β-value<0.2) and with a higher mean β-value in (i) normal samples which develop dysplasia (BDy), (ii) non-invasive dysplastic samples (Dy), and (iii) invasive cervical cancer (CA); (D) the bar chart indicating the enrichment of MESCs among those CpGs methylated in the normal cervix (mean β-value>0.4) and with a lower mean β-value in tissue representing the three stages of cervical carcinogenesis (BDy, Dy, and CA).

