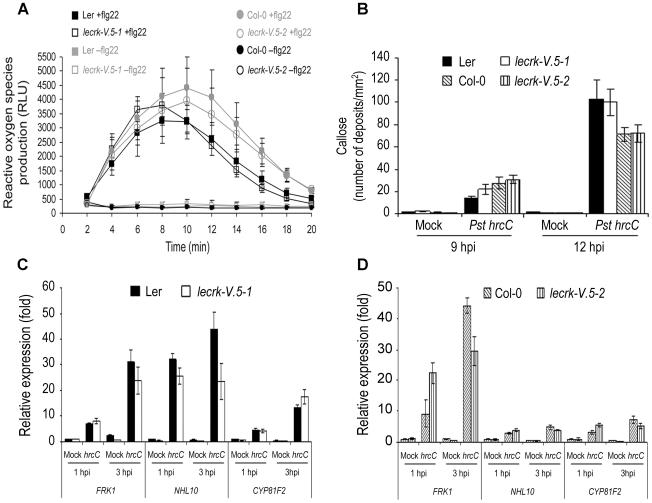
Figure 4. Apoplastic PTI responses in lecrk-V.5 mutants.
(A) Production of reactive oxygen species in Arabidopsis leaves after treatment with 1 µM flg22 as relative light units (RLU). Values represent averages ± SE (n = 6). (B) Callose deposition in WT or lecrk-V.5 mutants leaves infiltrated with 10 mM MgSO4 (Mock) or Pst DC3000 hrcC (Pst hrcC). Data represent the number of callose deposits per square millimeter ± SD. Differences were not significantly different to WT based on a t test (P<0.01). (C, D) FRK1, NHL10, CYP81F2 expression levels in WT or lecrk-V.5 mutant seedlings soaked in 10 mM MgSO4 (Mock) or 1×10⁷ cfu.ml−1 Pst DC3000 hrcC (hrcC). Transcript levels were determined by qRT-PCR and normalized to both EF-1 and UBQ10. Bars indicate SD (n = 9). All experiments were repeated 3 times with similar results.

