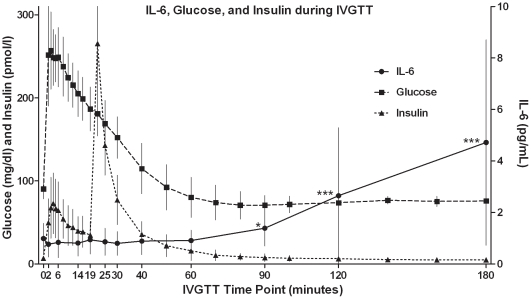
Figure 3. Plasma glucose, insulin, and IL-6 during frequently sampled intravenous glucose tolerance test (IVGTT).
Plasma concentrations of glucose (▪) and insulin (▴) (defined by the left Y axis) and IL-6 as measured by Meso Scale Discovery (•) (defined by the right Y axis) are shown. Glucose (50%, 0.3 g/kg body mass) was infused at time zero, and insulin (0.025 U/kg body mass) was infused at 20 minutes. Measurements are mean (SD) for n = fourteen subjects; * p value<0.05; ** p value<0.01 as compared to baseline.

