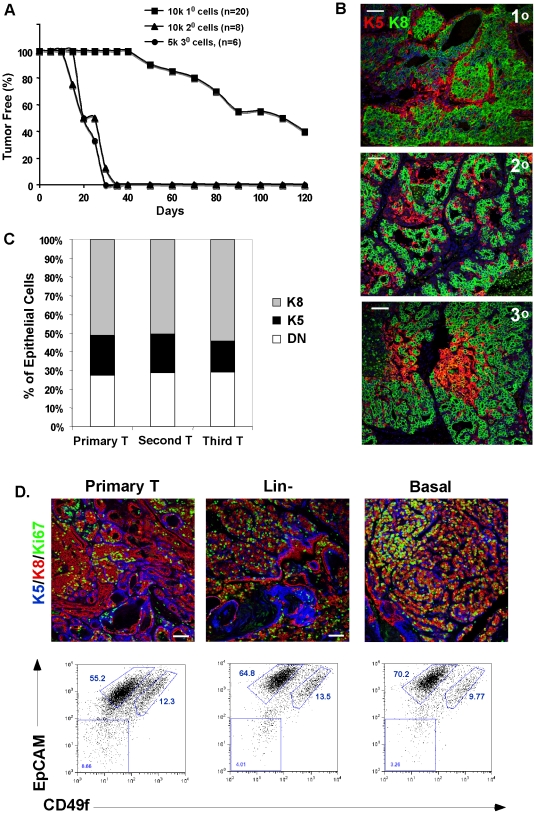
Figure 4. The tumor bi-lineal phenotype is stable over several generations and independent of tumor precursor cell.
(A) Tumor re-growth in serial transplantation was assayed over time, by palpation (generating a Kaplan-Meier curve; n = sample number), inoculating with the cell numbers indicated. (B) Immunostaining of primary, secondary, and tertiary DTumors with anti-K5 (red) and anti-K8 (green) antisera. Scale bar = 50 µm. (C) The proportion of cells staining for each lineage marker in vivo (assayed from 3 separate tumors for each generation; 3 fields each) for each of the primary tumor and two serially regenerated tumors (Second T and Third T). (D) Corresponding immunocytochemical analysis and flow cytometric analysis of tumor cell populations from a primary tumor, for comparison with tumors regenerated from cell isografts of limiting dilutions of the cell type indicated (Lin− and basal cell). Scale bar = 50 µm.

