
FIG. 1.
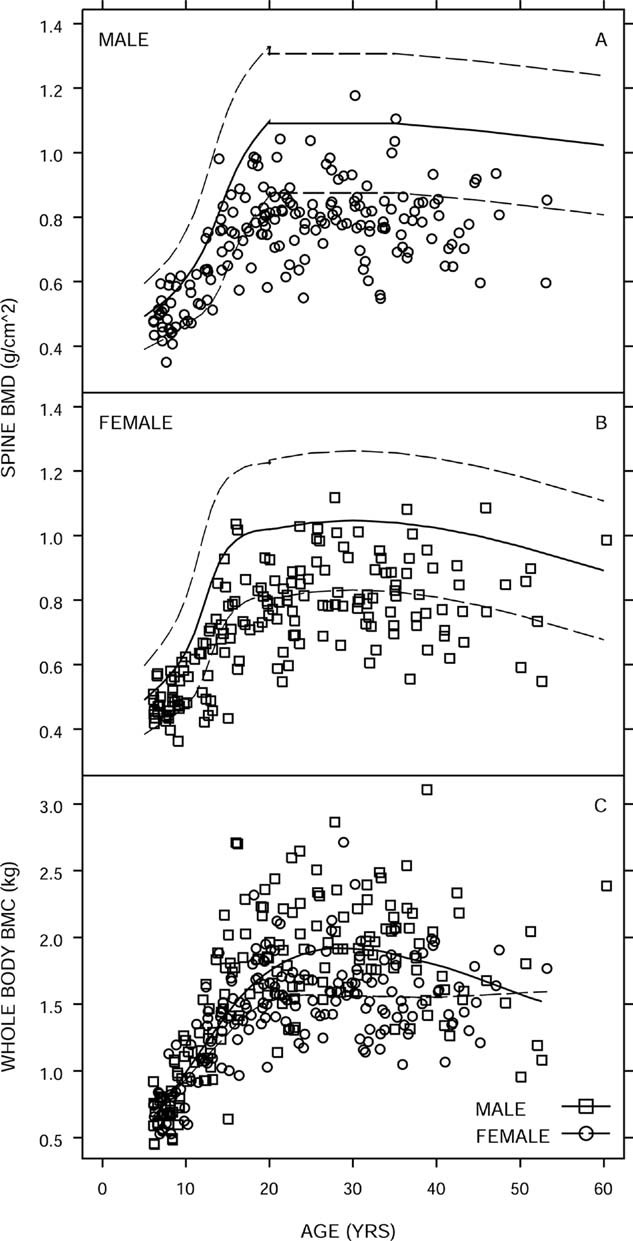
Bone mass vs. age. (A and B) Spine BMD (g/cm2) with age-dependent reference norms for whites (solid line) and ±2 SD (dashed lines) for males (A) and females (B). (C) Whole body BMC (kg) with locally weighted regressions for males (solid line) and females (dashed line). One individual age 75 yr is omitted (symbols: male, □; female, ○).