
FIG. 4.
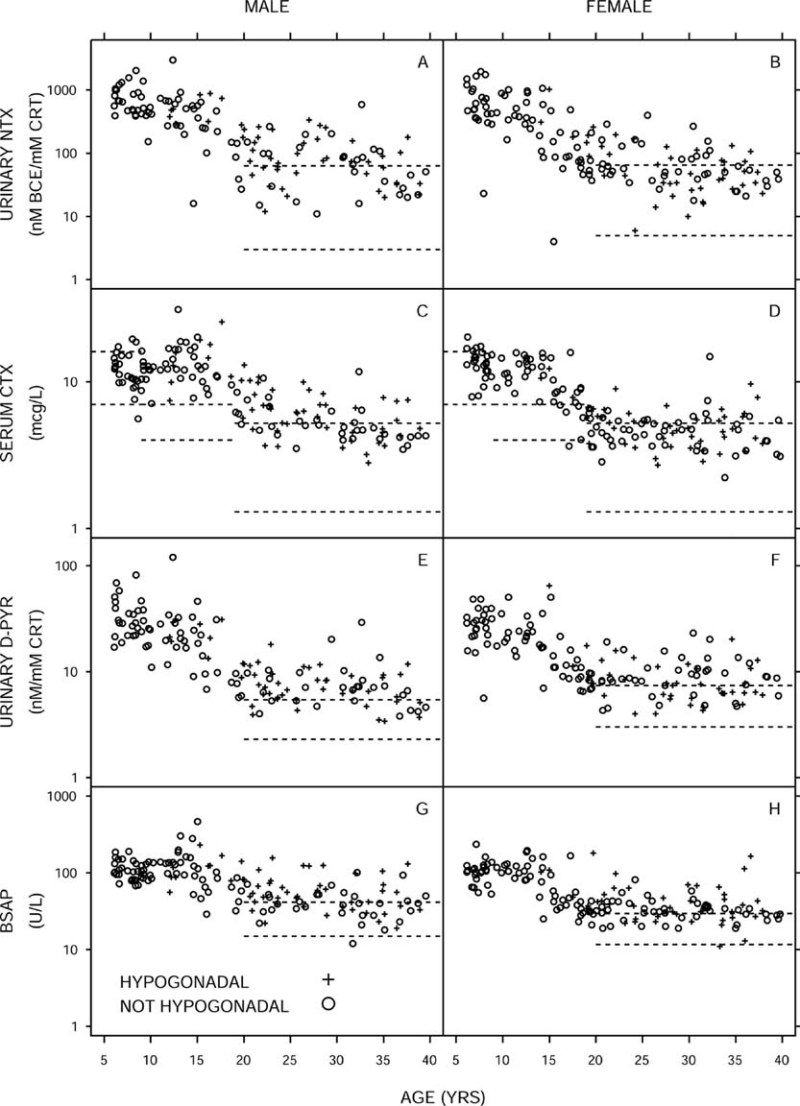
Bone turnover markers vs. age stratified by sex and hypogonadal status (hypogonadal, +; not hypogonadal, ○ ) with age-dependent upper and lower limits of normal (dashed lines). One individual age 75 yr is omitted.
Official websites use .gov
A
.gov website belongs to an official
government organization in the United States.
Secure .gov websites use HTTPS
A lock (
) or https:// means you've safely
connected to the .gov website. Share sensitive
information only on official, secure websites.
Bone turnover markers vs. age stratified by sex and hypogonadal status (hypogonadal, +; not hypogonadal, ○ ) with age-dependent upper and lower limits of normal (dashed lines). One individual age 75 yr is omitted.