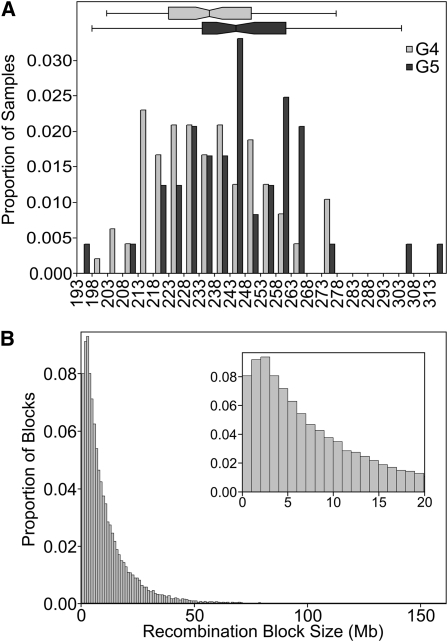
Figure 4 .
Recombination in the DO. (A) Distribution of the number of recombinations per DO sample. The generation plot is normalized by population size. Shaded bars are G4 (n = 94); solid bars are G5 (n = 47). (B) Distribution of recombination segment size among the DO. Inset details the distribution of segments ≤20 Mb.

