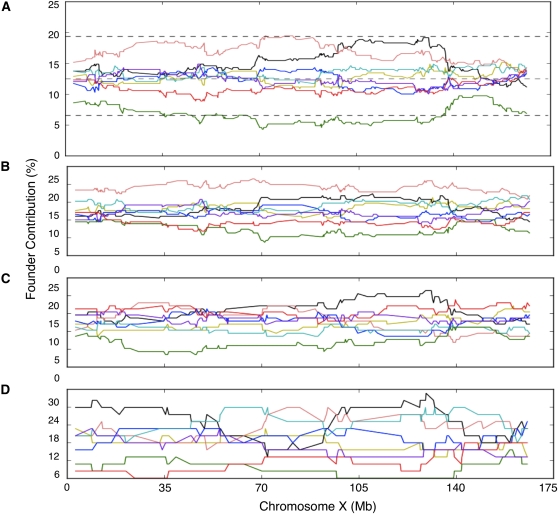
Figure 4 .
Local founder strain contribution on chromosome X. (A) Final CC population, (B) CC-UNC population, (C) CC-TAU, and (D) CC-GND population. The percentage contribution from each founder is represented as a continuous line using the color schema shown in Figure 1. The dotted lines represent the threshold for TRD at P = 0.05 adjusted for genome-wide significance.

