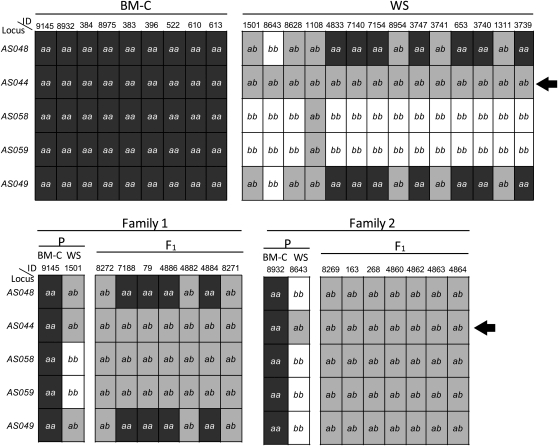
Figure 4 .
Genotyping data for five Fm-linked DNA markers in BM-C (n = 9), WS (n = 14), and F1 (n = 14) between BM-C and WS in families 1 and 2. A haplotype pattern of PCR-RFLP is indicated as a or b. Individuals that showed the a or b band pattern are described as aa or bb, respectively, and individuals that displayed the a plus b band pattern are shown as ab. On the AS044 locus (arrows), all WS and F1 individuals displayed the ab band pattern. ID, identification number. Details of these loci are shown in Table S1.

